Key Features
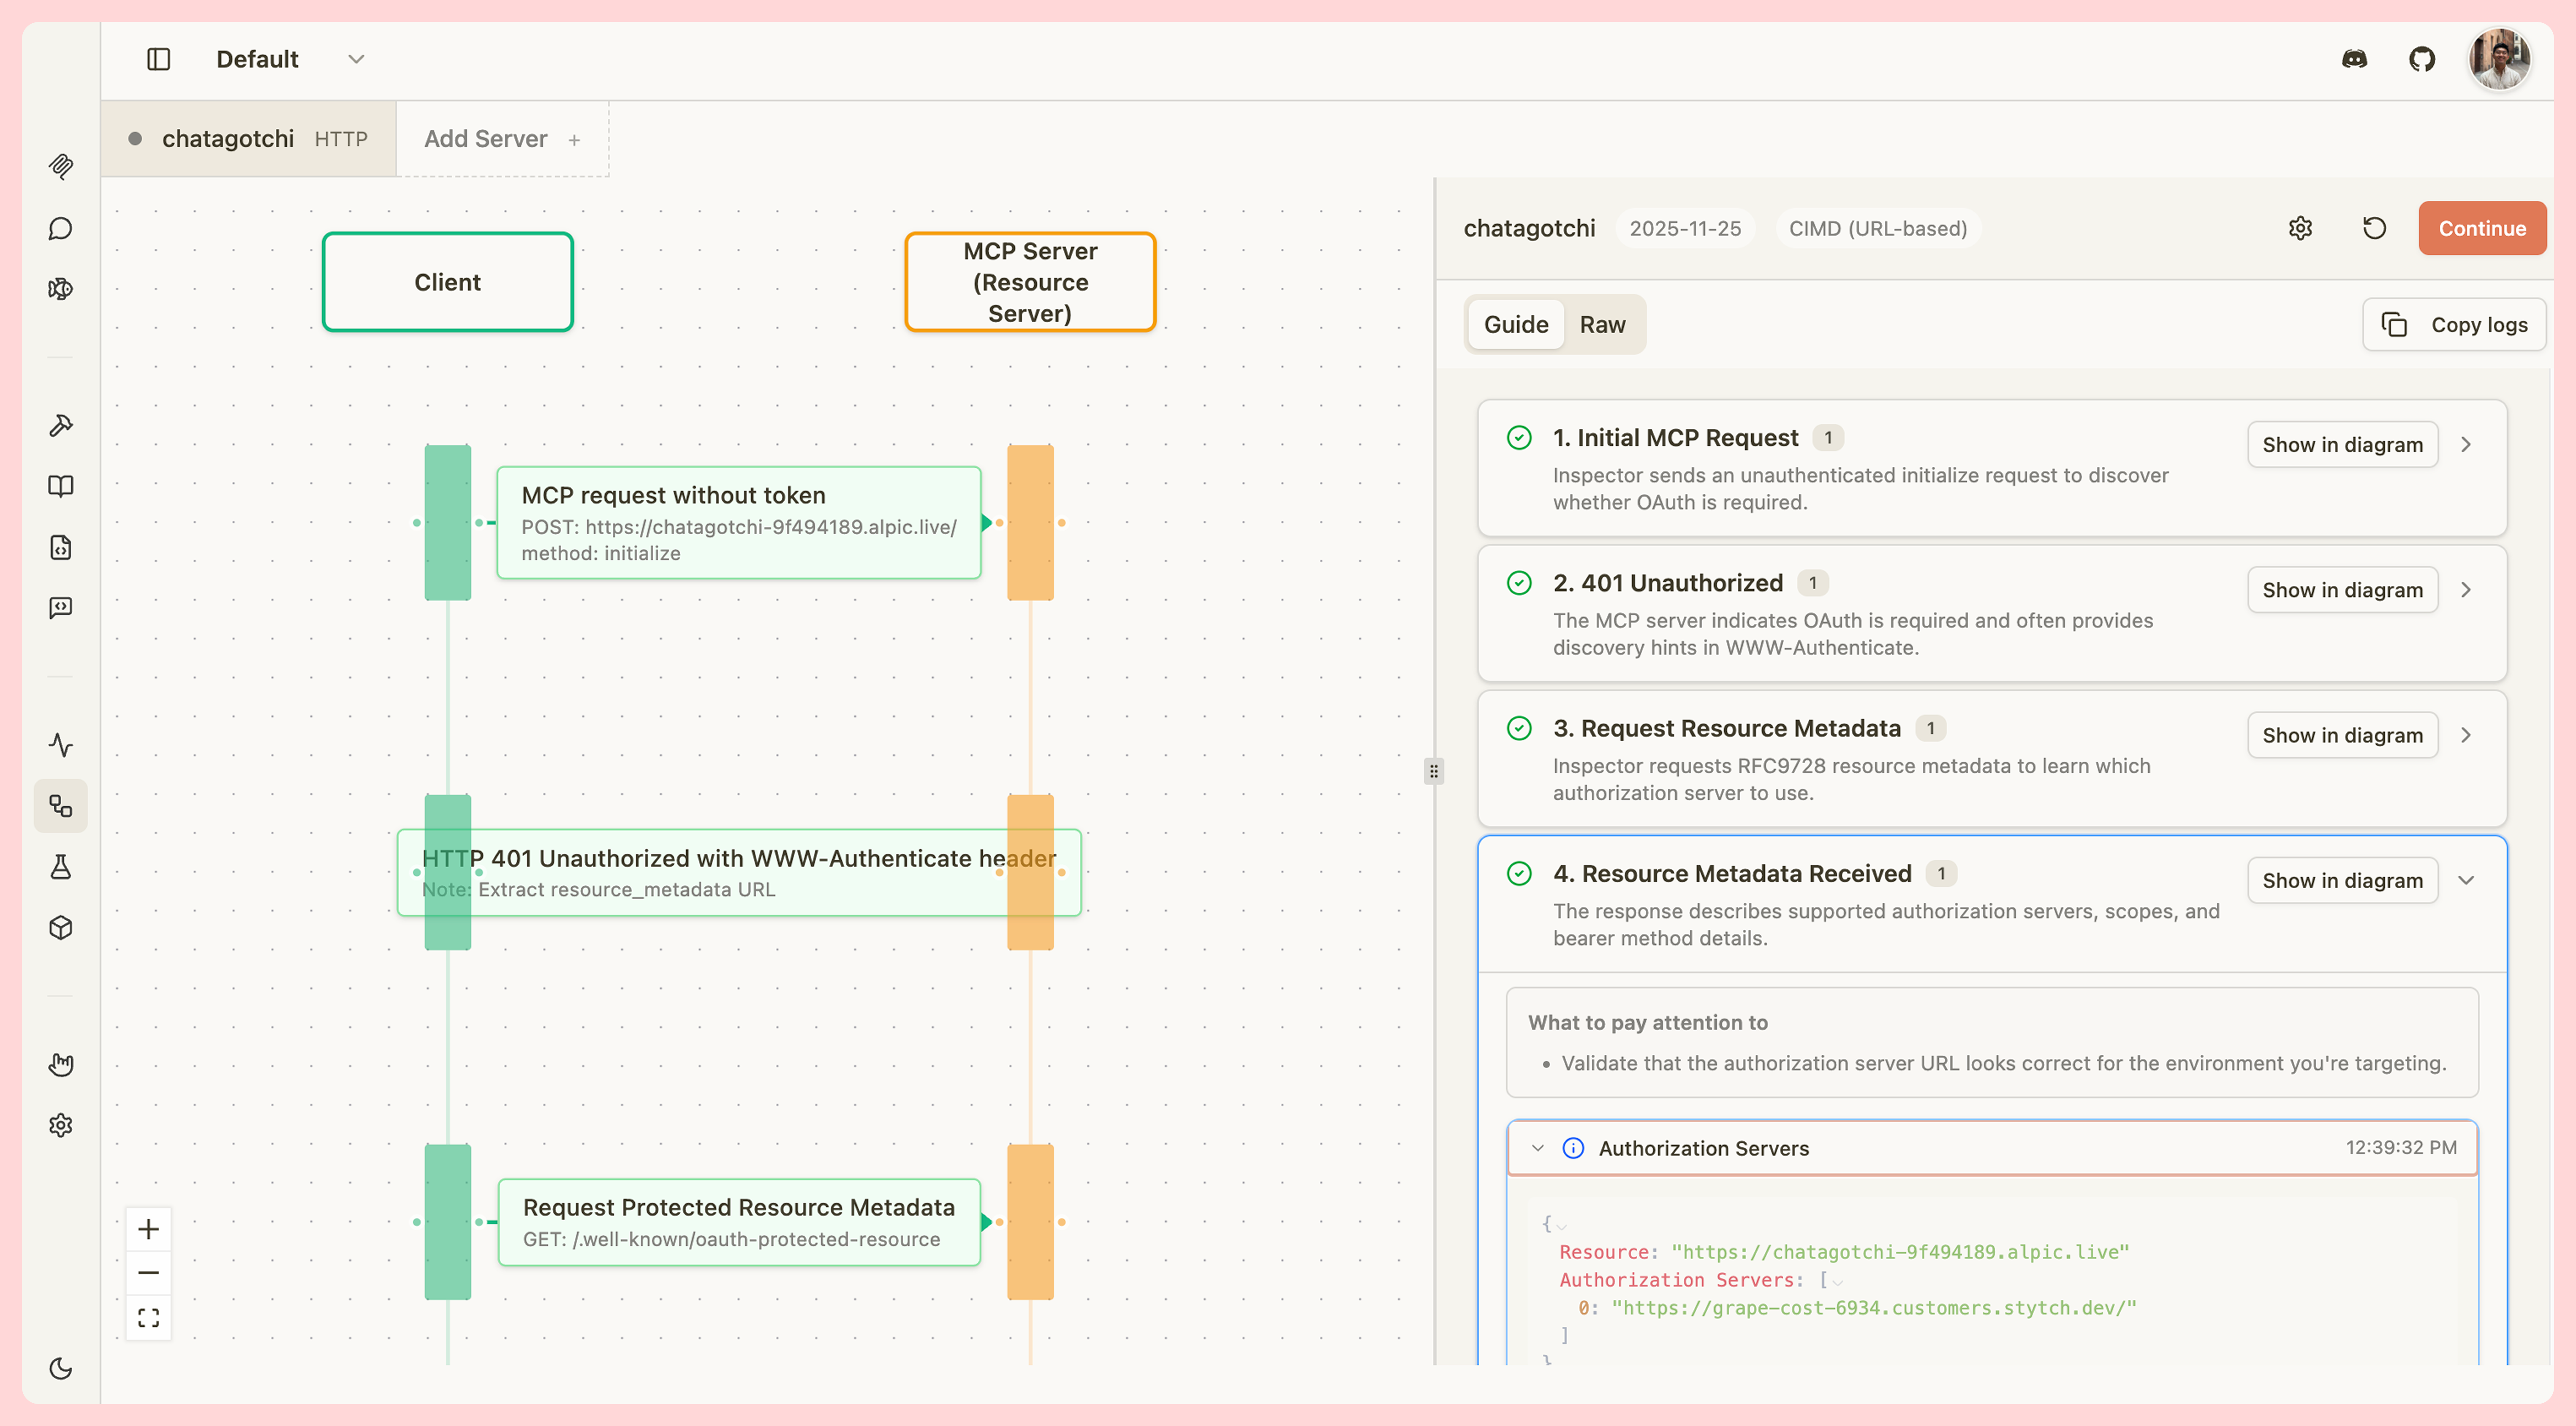
The OAuth Debugger provides comprehensive tooling for testing OAuth implementations:- Visual Step-by-Step Guide - Interactive flow guide with detailed explanations for each OAuth step
- Multi-Protocol Support - Test against OAuth spec versions 03-26, 06-18, and 11-25
- Full Registration Methods - Support for client pre-registration, Dynamic Client Registration (DCR), and Client ID Metadata Documents (CIMD)
- Network Inspection - View all HTTP requests and responses with headers and body content
- Educational Context - Built-in teachable moments and tips for common OAuth issues
- Sequence Diagram - Visual representation of the OAuth flow synchronized with your progress
- Export Capabilities - Copy logs in guide or raw format for debugging and documentation
Getting Started
To begin debugging OAuth flows:- Navigate to the OAuth Debugger - Click the OAuth Flow tab in MCPJam Inspector
- Configure a Target Server - Click Configure Target to open the OAuth Profile Modal
- Enter Server Details - Provide your server’s base URL and select your protocol version
- Choose Registration Method - Select CIMD, DCR, or pre-registered based on your implementation
- Start Testing - Click Continue to begin the OAuth flow